
Annual registrations
2017–2024 history and the subsequent trend
2017
2,994
2018
4,194
2019
6,275
2020
8,360
2021
10,561
2022
11,121
2023
15,378
2024
21,042
Daily CEPiK data through: 21 Aug 2026
ATV / UTV / SSV MARKET DATA
Registrations, models, regions, prices and companies organised for use in everyday decisions.
Complete access from €39 net/month with annual billing. The preview remains available without a card.
DATA SAMPLE
Annual history is public. Current volumes, shares and counties remain securely inside the dashboard.
Daily CEPiK data through: 21 Aug 2026
Annual registrations
2017
2,994
2018
4,194
2019
6,275
2020
8,360
2021
10,561
2022
11,121
2023
15,378
2024
21,042
Daily CEPiK data through: 21 Aug 2026
Ranking of 53 brands
Daily CEPiK data through: 21 Aug 2026
Regional demand
Real demand gradient with normalised values. Counties and figures unlock with a paid plan.
Daily CEPiK data through: 21 Aug 2026
DATASET STRUCTURE
The panel's value comes from combining dimensions. Start with the whole market, move to a segment, brand or model, then examine a region, company or distribution network.
Month, quarter, current year, previous year, last 3/6/12 months and the complete available history.
ATV or UTV/SSV segment, brand, brand family, model, new or used status and available model-year attributes.
Poland, region and county; regional views compare demand concentration and growth.
Manufacturer or brand, importer, dealer, other company, location, brand portfolio and sales-channel relationships.
Model price, gross and net value, price index, direct coverage and assumptions for used vehicles.
Generation date, latest month, period coverage, source type, limitations and an estimated-result marker.
MODULE BY MODULE
Market size and growth, value, segments, registration origin and quick rankings.
Rankings, share, new and used units, importers, dealers, active models and a profile for each brand.
Separate segment views with trends, brands, models and demand structure.
Searchable model ranking, volume, brand, segment and separation of new and used registrations.
Regional registration distribution across regions and counties, with vehicle-type comparisons.
Secondary-market share, brands, models, age and estimated residual value.
Changes in model activity over time and signals of growth, stability, seasonality and decline.
Estimated vehicle value from registrations and model prices, with visible coverage and methodology.
Market participant catalogue, profiles, contacts, registry data, brands and selected financial signals.
Brand–importer–dealer relationship graph with search, filtering and distribution-concentration analysis.
Data origin, freshness, reach, limitations and responsible-interpretation guidance.
IMPORTANT DISTINCTIONS
WHAT EXACTLY YOU ARE BUYING
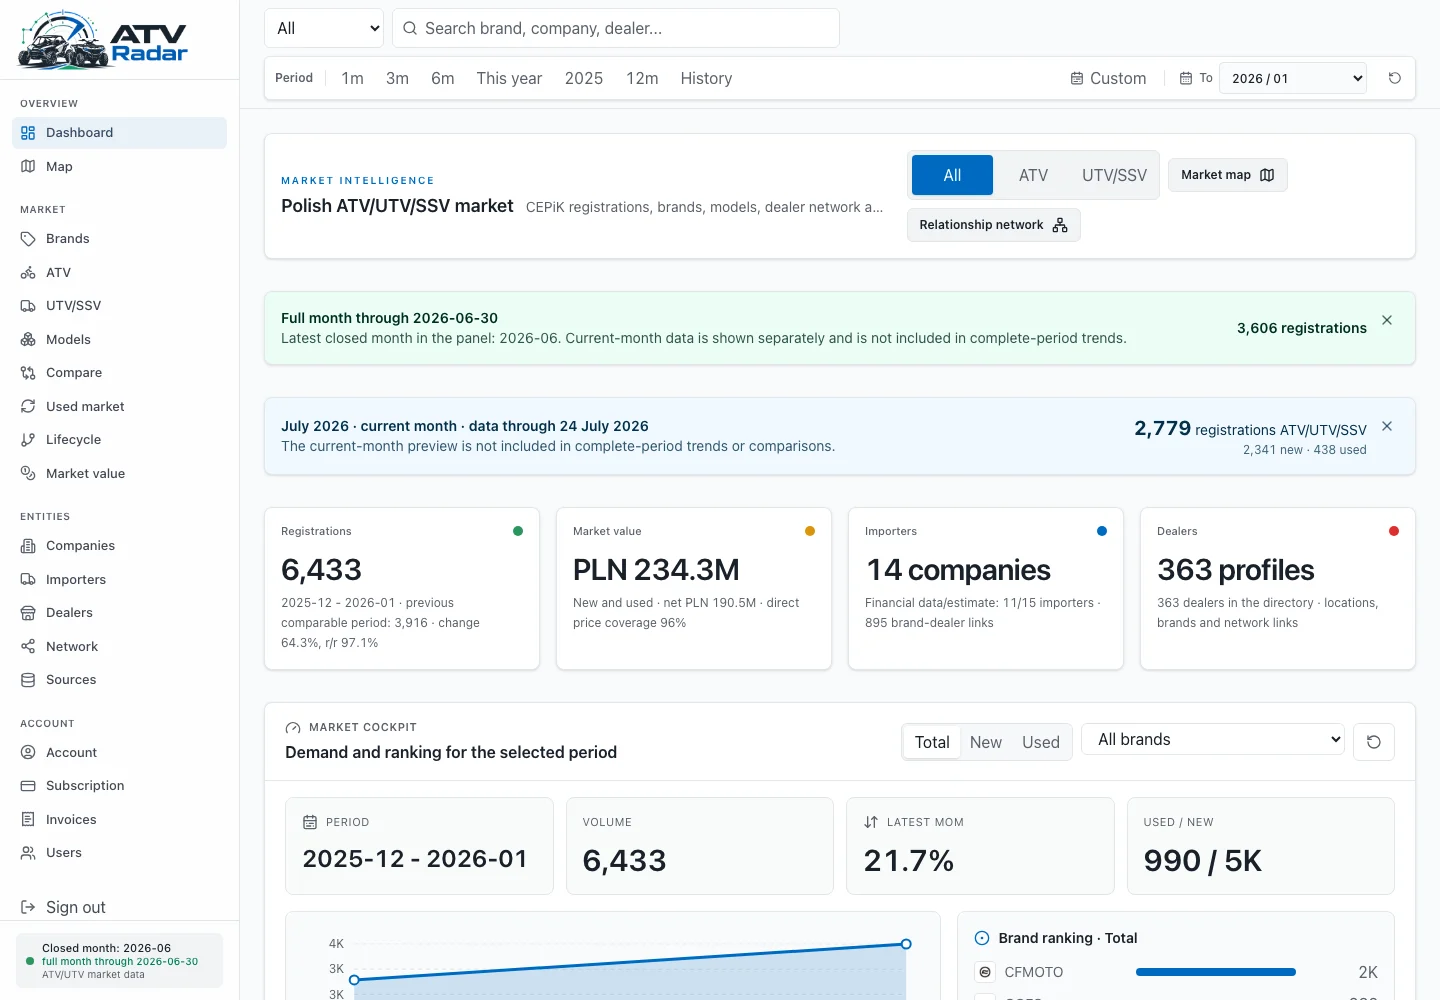
Key KPIs, growth and a quick view of the market.
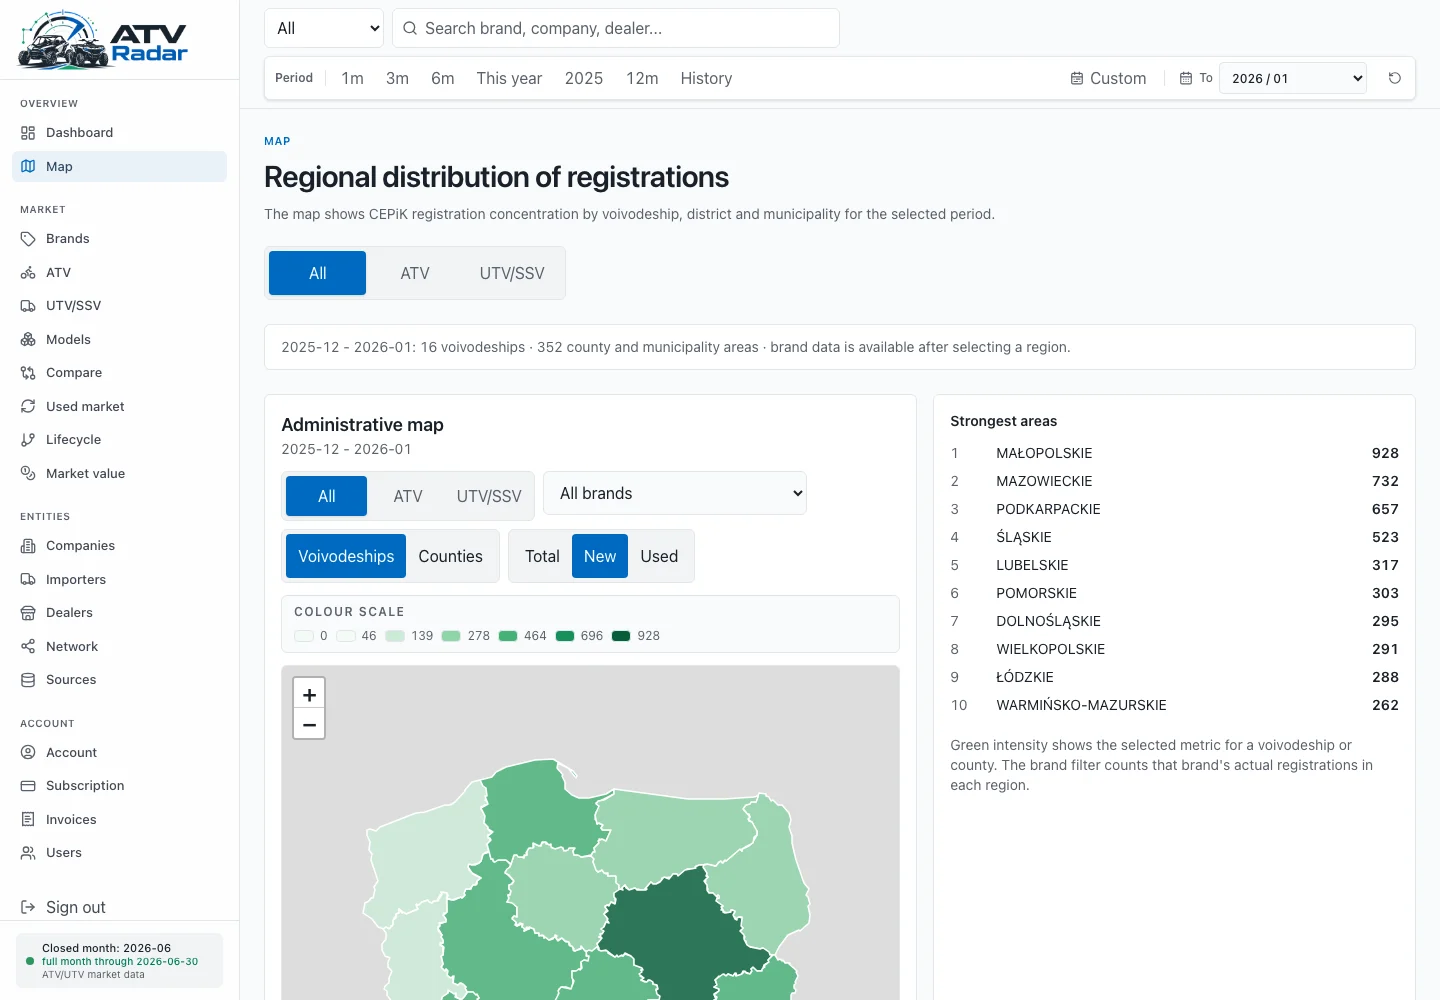
Regions, counties and local white spots.
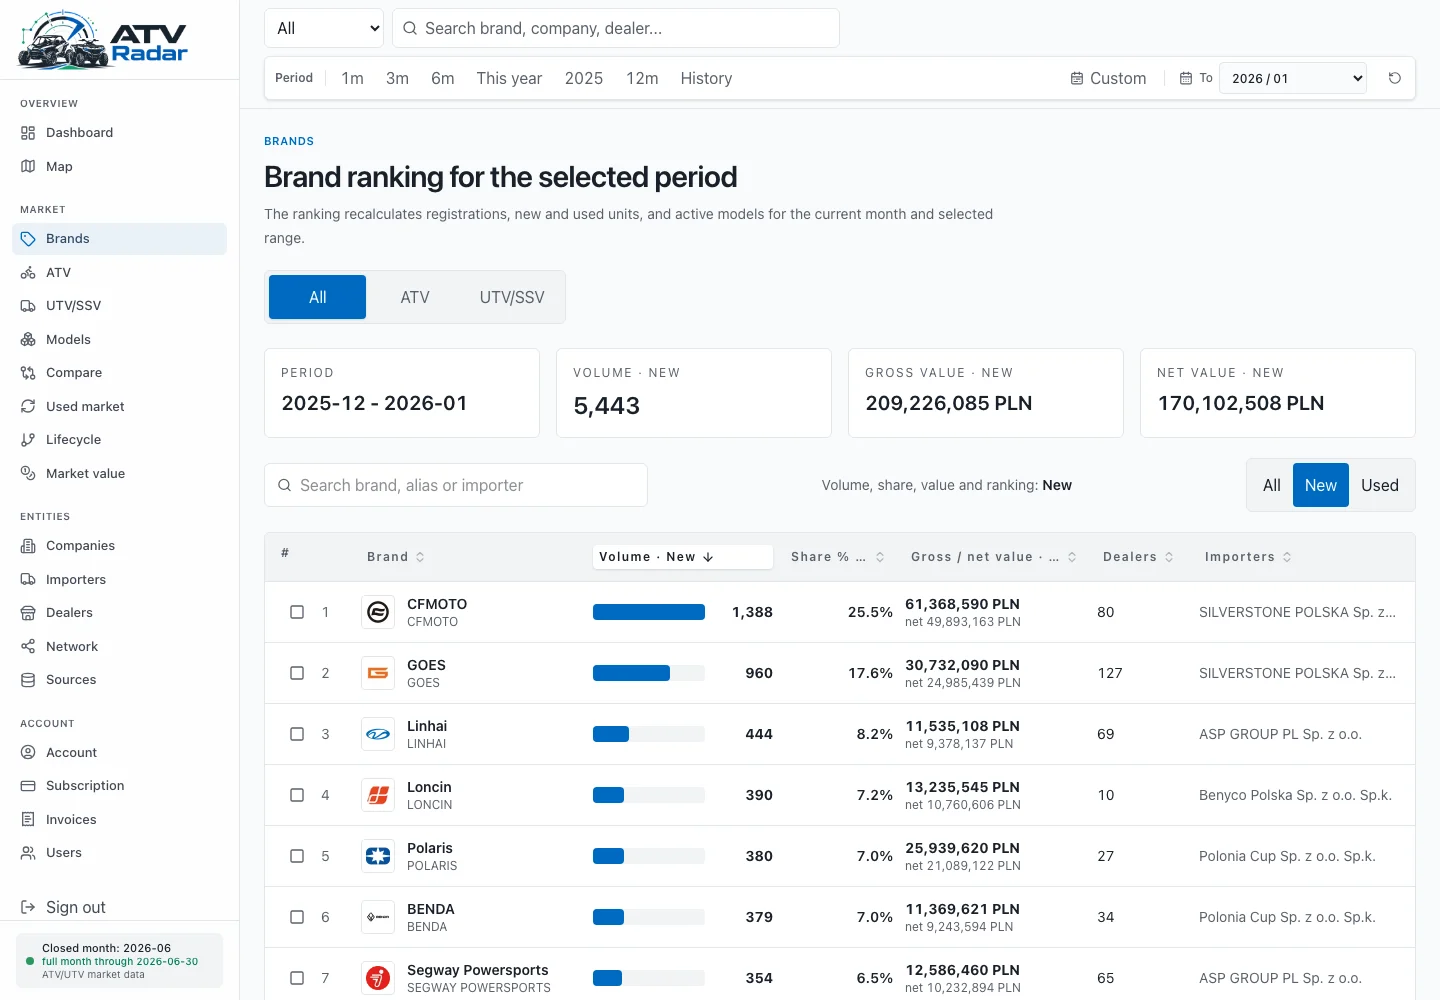
Rankings, shares and competitive comparisons.
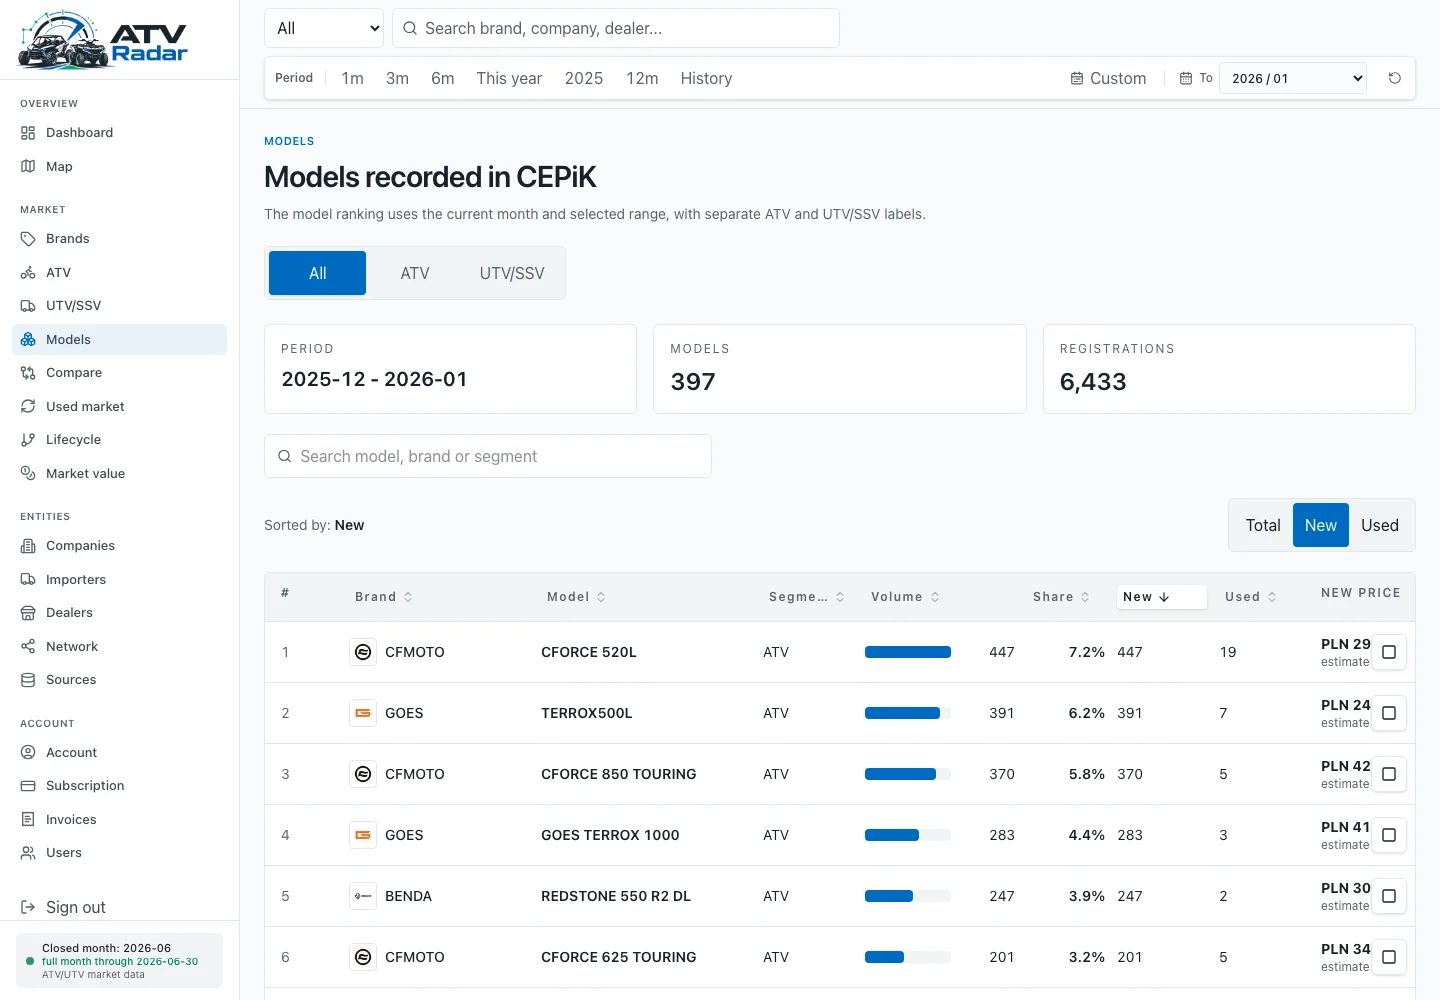
Volumes, segments and model-level demand trends.
New vs used vehicles, origin and lifecycle.
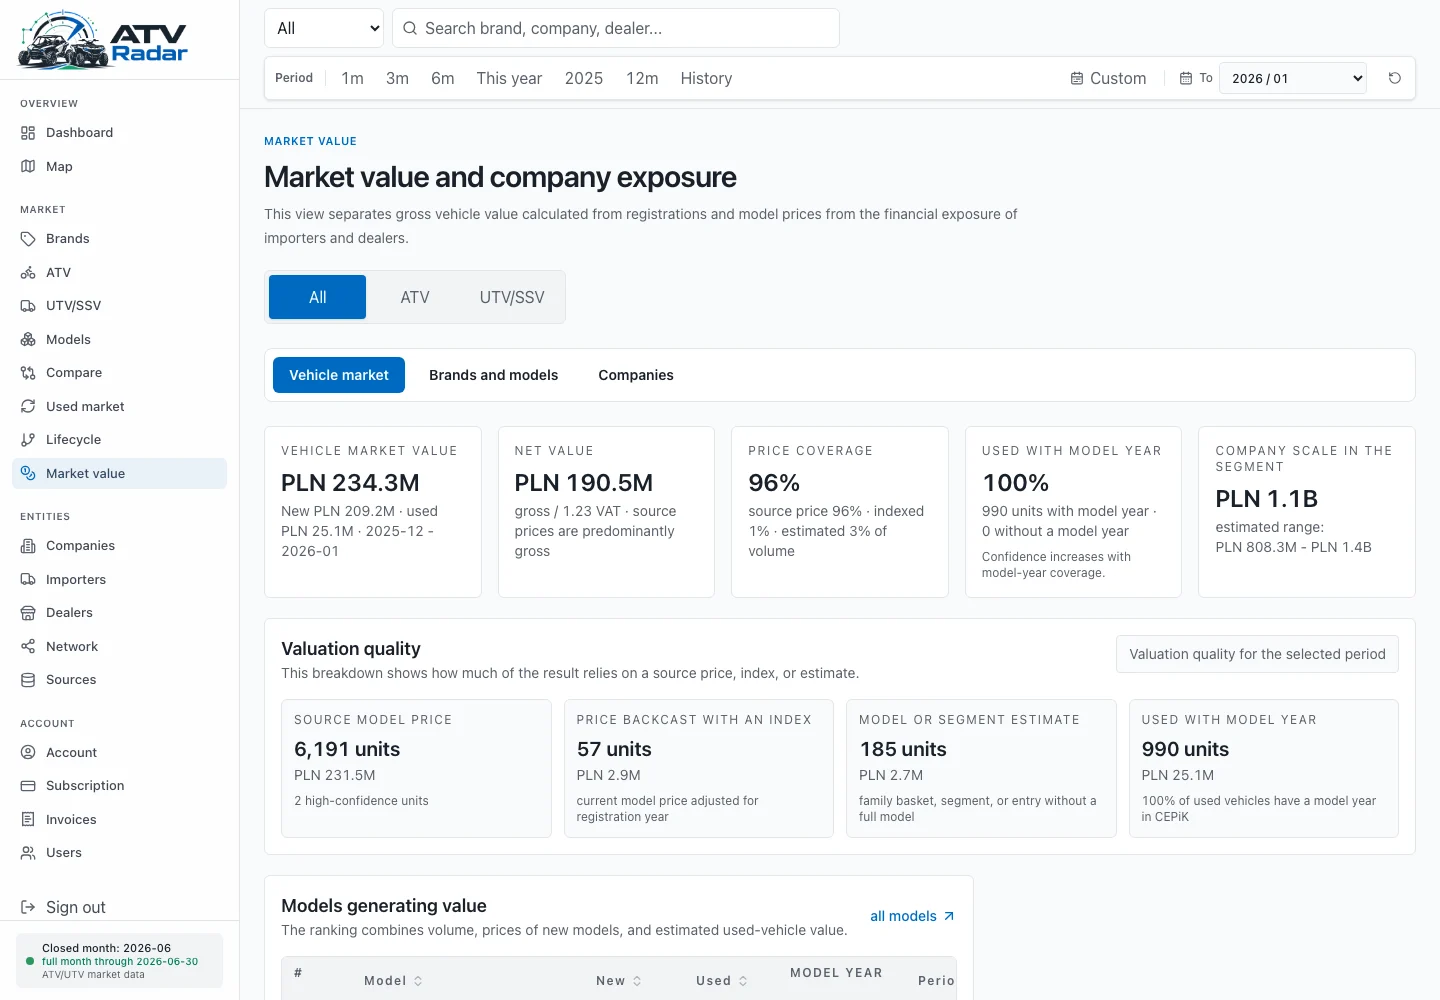
Prices, net value and estimation assumptions.
Company profiles and represented brand portfolios.
Entity catalogue and regional coverage.
Relationships and sales-network gaps.
Brand vs brand and model vs model in one view.
Signals from subsequent registrations and fleet age.
Data ready for further team analysis.
CURRENT DATA. COMPLETE ACCESS. NOW.
Daily CEPiK data through: 21 Aug 2026
Complete access from €39 net/month with annual billing. The preview remains available without a card.